
Googleアナリティクスでは、各ディメンションごとのトレンド(傾向)を、手軽に把握したいときありますよね。それをうまくビジュアライズしてくれるツールが公式に出ていました。
こんにちは、Googleアナリティクス大好きカグア!です。
本記事では、Googleアナリティクス公式のGoogle Analytics Demos & Tools で紹介されています Usage Trends(ユーセイジトレンド) を解説します。
関連記事
>>Googleアナリティクスではグラフの比較も最大で8個まで可能
>>Googleアナリティクス基礎:パラメーターの設定や使い方<完全版>
>>Googleタグマネージャの公式サイトが超カッコよくなってる
>>Googleアナリティクス国内トップテクノロジストまとめ2015
この記事の目次
Usage Trends とは
Googleアナリティクスで、集客>すべてのトラフィック>チャネル>グラフに表示 としますと、選択したディメンションが、それぞれグラフ上に色付きでプロットされますよね。

これって、全部同じ縦軸での表示ですから、とくに絶対数が少ないディメンションですと、ほぼ真っすぐに見えちゃいますよね。増えているのか減っているのか、というトレンド(傾向)をみたいなーと思ったとき、セグメントやアドバンスフィルタで絞り込んでから、比較しますとまあ分かりやすくなりますよね。
でも、そこで、Usage Trends です。
Usage Trends を使いますと、上昇トレンドなのか右肩下がりなのかといった趨勢を、たった1クリックで、各ディメンションごとにわかりやすく分解してくれます。

トレンドをざっくり把握したいときに役立ちそうですよね。もちろん、無料で使えます。
それでは、Usage Trends の使い方をご紹介します。
Usage Trends の使い方
Google Analytics Demos &Tools
Usage Trends は、Google Analytics Demos &Tools で紹介されています。
Google Analytics Demos &Tools とは、Googleが公式に紹介していますツールやデモをまとめたページです。

>>Discover the Google Analytics platform — Google Analytics Demos & Tools
Google Analytics Demos &Tools では、キャンペーンURL生成や、ヒットビルダーなど、Googleアナリティクスの可能性を引き出してくれるツールや先進的なデモを見せてくれます。
これまでは、Googleアナリティクスのヘルプ内に散財してましたが、いつからかこうした取り組みをまとめたページへと昇華していました。
それでは、Google Analytics Demos & Tools の画面左下にあります「Usage Trends」をクリックし、早速 Usage Trends を使っていきましょう。
なお、Usage Trends は以下のリンクからも直接アクセスできます。
>>Usage Trends — Google Analytics Demos & Tools
Usage Trends で認証
初めてUsage Trendsを使いますと、以下のように認証を要求されます。そのままクリックして、利用するアカウントを選んで下さい。

Googleアナリティクスアカウントの認証が通りますと、次のようにレポートさせるプロパティなどを選ぶ画面に変わります。
ディメンションや期間を選択
Usage Trendsの使い方はとても簡単です。
画面左の「利用したいアカウントやプロパティ」を選びます。次に、指標とディメンションと期間、いくつのディメンションを表示するか(最大10)を選びます。

たったこれだけです。
最後に「create trend report」をクリックします。
指定数のトレンドが表示
すぐにUsage Trendsがそれぞれのディメンションを抽出し、トレンドを表示してくれます。

なんか、ひさしぶりに痛快なツールをよくぞ出してくれました!という感じですね。とはいえ、厳密に数字を理解するために使うのではなく、トレンドをさくっと俯瞰するために使うのが良いかと思います。
Usage Trends のレポートの見方
縦軸がパーセント表示される
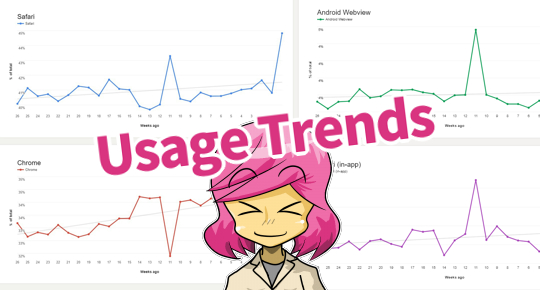
トレンドは、縦軸を絶妙に最適幅にして、抽出したディメンションのトレンドを見やすくしてくれます。折れ線グラフの傾向線も灰色で示してくれます。

抽出数が「5」であれば、このようなトレンドのグラグを5つ表示してくれます。一括表示ですと認識しづらかった、各ディメンション値ごとのトレンドを把握しやすくなります。
トレンド観測の具体例
このUsage Trends はまさにトレンドをさくさくと俯瞰することに適しています。ですから、戦略が煮詰まったり、新たなアプローチを模索するときの原資を見つけるときなどに、不定期にチェックするのが良いかと思います。
それでは、具体的にトレンド観測の事例を見ていきましょう。
年代別の売上件数トレンド
- 指標:Transactions(売上件数)
- ディメンション:Age(年代)

「なんか、25~34才の売上件数、増えてるなー。」
曜日ごとの売上件数
- 指標:Transactions
- ディメンション:Day of Week Name

「過去2年で見てみると、金曜日の売上件数、これ伸びてるんじゃないの?何かあったっけ?」「とにかく仮説検証するために、まずは3ヶ月金曜にセールを打つ予算をつけるか!」
SEOチューニング
- 指標:Sessions
- ディメンション:Landing Page

「SEO順位が下がってたあのLP、チューニングしたらまた復活してきたな!」
・ ・ ・ ・ ・
いかがでしょうか。セグメントである程度抽出すれば、デフォルトの「グラフに表示」でもトレンドはわかりますが、それでもUsage Trends の簡単さは新たな発見もあるのではと思いました。
サイト運営においてトレンドを把握するって、ほんと重要ですよね。
指標とディメンション一覧
レポートに使える指標
1 Day Active Users
14 Day Active Users
30 Day Active Users
7 Day Active Users
AdSense Ad Units Viewed
AdSense Ads Clicked
AdSense Coverage
AdSense Exits
AdSense Impressions
AdSense Page Impressions
AdSense Revenue
AdSense Viewable Impression %
AdX Clicks
AdX Coverage
AdX CTR
AdX eCPM
AdX Impressions
AdX Impressions / Session
AdX Monetized Pageviews
AdX Revenue
AdX Revenue / 1000 Sessions
AdX Viewable Impressions %
Avg. Time on Screen
Bounces
Buy-to-Detail Rate
Cart-to-Detail Rate
Clicks
Cost
Crashes
Custom Metric 1~5
DBM Clicks
DBM Conversions
DBM Cost
DBM Impressions
DCM Clicks
DCM Conversions
DCM Cost
DCM CPC
DCM CTR
DCM Impressions
DCM Revenue
DCM ROAS
DCM RPC
DFP Backfill Clicks
DFP Backfill Coverage
DFP Backfill CTR
DFP Backfill eCPM
DFP Backfill Impressions
DFP Backfill Impressions / Session
DFP Backfill Monetized Pageviews
DFP Backfill Revenue
DFP Backfill Revenue / 1000 Sessions
DFP Backfill Viewable Impressions %
DFP Clicks
DFP Coverage
DFP CTR
DFP eCPM
DFP Impressions
DFP Impressions / Session
DFP Monetized Pageviews
DFP Revenue
DFP Revenue / 1000 Sessions
DFP Viewable Impressions %
Document Content Loaded Time (ms)
Document Interactive Time (ms)
DOM Latency Metrics Sample
Domain Lookup Time (ms)
DS Clicks
DS Cost
DS Impressions
Entrances
Event Value
Exceptions
Exits
Goal 1~20 Completions
Goal 1~20 Starts
Goal 1~20 Value
Goal Completions
Goal Starts
Goal Value
Hits
Impressions
Internal Promotion Clicks
Internal Promotion Views
Local Product Refund Amount
Local Product Revenue
Local Refund Amount
Local Revenue
Local Shipping
Local Tax
New Users
Number of Sessions per User
Organic Searches
Page Download Time (ms)
Page Load Sample
Page Load Time (ms)
Page Value
Pageviews
Product Adds To Cart
Product Checkouts
Product Detail Views
Product List Clicks
Product List Views
Product Refund Amount
Product Refunds
Product Removes From Cart
Product Revenue
Quantity
Quantity Added To Cart
Quantity Checked Out
Quantity Refunded
Quantity Removed From Cart
Redirection Time (ms)
Refund Amount
Refunds
Results Pageviews
Revenue
Revenue per User
Screen Views
Search Depth
Search Exits
Search Refinements
Server Connection Time (ms)
Server Response Time (ms)
Session Duration
Sessions
Sessions with Event
Sessions with Search
Shipping
Social Actions
Speed Metrics Sample
Tax
Time after Search
Time on Page
Time on Screen
Total Events
Total Unique Searches
Total Users
Transactions
Transactions per User
Unique Dimension Combinations
Unique Events
Unique Pageviews
Unique Purchases
Unique Screen Views
Unique Social Actions
Unique Views 1~5
User Timing (ms)
User Timing Sample
Users
レポートに使えるディメンション
Acquisition Campaign
Acquisition Channel
Acquisition Medium
Acquisition Source
Acquisition Source / Medium
Ad Content
Ad Distribution Network
Ad Format
Ad Group
Ad Slot
AdWords Ad Group ID
AdWords Campaign ID
AdWords Creative ID
AdWords Criteria ID
AdWords Customer ID
Affiliation
Affinity Category (reach)
Age
App ID
App Installer ID
App Name
App Version
Browser
Browser Size
Browser Version
Campaign
Campaign Code
Checkout Options
City
City ID
Cohort
Continent
Continent ID
Count of Sessions
Country
Country ISO Code
Currency Code
Custom Dimension 1~xx
Custom Variable (Key 1~5)
Custom Variable (Value 1~5)
Data Source
Date
Date Hour and Minute
Day
Day Index
Day of the month
Day of Week
Day of Week Name
Days Since Last Session
Days to Transaction
DBM Advertiser (DCM Model)
DBM Advertiser (GA Model)
DBM Advertiser ID (DCM Model)
DBM Advertiser ID (GA Model)
DBM Creative ID (DCM Model)
DBM Creative ID (GA Model)
DBM Exchange (DCM Model)
DBM Exchange (GA Model)
DBM Exchange ID (DCM Model)
DBM Exchange ID (GA Model)
DBM Insertion Order (DCM Model)
DBM Insertion Order (GA Model)
DBM Insertion Order ID (DCM Model)
DBM Insertion Order ID (GA Model)
DBM Line Item (DCM Model)
DBM Line Item ID (DCM Model)
DBM Line Item ID (GA Model)
DBM Line Item NAME (GA Model)
DBM Site (DCM Model)
DBM Site (GA Model)
DBM Site ID (DCM Model)
DBM Site ID (GA Model)
DCM Activity
DCM Activity and Group
DCM Activity Group
DCM Activity Group ID
DCM Activity ID
DCM Ad
DCM Ad (GA Model)
DCM Ad ID (DCM Model)
DCM Ad ID (GA Model)
DCM Ad Type (DCM Model)
DCM Ad Type (GA Model)
DCM Ad Type ID
DCM Ad Type ID (DCM Model)
DCM Advertiser (DCM Model)
DCM Advertiser (GA Model)
DCM Advertiser ID
DCM Advertiser ID (DCM Model)
DCM Advertiser ID (GA Model)
DCM Attribution Type (DCM Model)
DCM Campaign (DCM Model)
DCM Campaign (GA Model)
DCM Campaign ID (DCM Model)
DCM Campaign ID (GA Model)
DCM Creative (DCM Model)
DCM Creative (GA Model)
DCM Creative ID (DCM Model)
DCM Creative ID (GA Model)
DCM Creative Type (DCM Model)
DCM Creative Type (GA Model)
DCM Creative Type ID (DCM Model)
DCM Creative Type ID (GA Model)
DCM Creative Version (DCM Model)
DCM Creative Version (GA Model)
DCM Floodlight Configuration ID
DCM Floodlight Configuration ID (DCM Model)
DCM Floodlight Configuration ID (GA Model)
DCM Placement (DCM Model)
DCM Placement (GA Model)
DCM Placement ID (DCM Model)
DCM Placement ID (GA Model)
DCM Rendering ID (DCM Model)
DCM Rendering ID (GA Model)
DCM Site (DCM Model)
DCM Site (GA Model)
DCM Site ID (DCM Model)
DCM Site ID (GA Model)
Default Channel Grouping
Destination Page
Destination URL
Device Category
Display URL
DS Ad Group
DS Ad Group ID
DS Advertiser
DS Advertiser ID
DS Agency
DS Agency ID
DS Campaign
DS Campaign ID
DS Engine Account
DS Engine Account ID
DS Keyword
DS Keyword ID
Event Action
Event Category
Event Label
Exception Description
Exit Page
Exit Screen
Experiment ID
Flash Version
Full Referrer
Gender
Goal Completion Location
Goal Previous Step – 1
Goal Previous Step – 2
Goal Previous Step – 3
Hostname
Hour
Hour Index
Hour of Day
In-Market Segment
Internal Promotion Creative
Internal Promotion ID
Internal Promotion Name
Internal Promotion Position
ISO Week of ISO Year
ISO Week of the Year
ISO Year
Java Support
Keyword
Keyword Match Type
Landing Page
Landing Page Group 1~5
Landing Screen
Language
Latitude
Longitude
Medium
Metro
Metro Id
Minute
Minute Index
Mobile Device Branding
Mobile Device Info
Mobile Device Marketing Name
Mobile Device Model
Mobile Input Selector
Month
Month Index
Month of the year
Month of Year
Network Domain
Operating System
Operating System Version
Order Coupon Code
Other Category
Page
Page Depth
Page Group 1~5
Page path level 1~4
Page Title
Placement Domain
Placement Type
Placement URL
Previous Page Group 1~5
Previous Page Path
Product
Product Brand
Product Category
Product Category (Enhanced Ecommerce)
Product Category Level 1~5
Product Coupon Code
Product List Name
Product List Position
Product SKU
Product Variant
Query Match Type
Query Word Count
Referral Path
Refined Keyword
Region
Region ID
Region ISO Code
Screen Colors
Screen Depth
Screen Name
Screen Resolution
Search Destination Page
Search Query
Search Term
Second Page
Service Provider
Session Duration
Sessions to Transaction
Shopping Stage
Site Search Category
Site Search Status
Social Action
Social Entity
Social Network
Social Network
Social Network and Action
Social Source Referral
Social Type
Source
Source / Medium
Source Property Display Name
Source Property Tracking ID
Start Page
Sub Continent
Sub Continent Code
Targeting Type
Timing Category
Timing Label
Timing Variable
Transaction ID
TrueView Video Ad
User Bucket
User Defined Value
User Type
Variant
Week
Week Index
Week of the Year
Week of Year
Year
レポートに関する注意点
レポートの縦軸が%になっている
レポートの縦軸は、合計をディメンション別に分解しそのパーセンテージに変換しています。ただ、ディメンション(例えばユーザーなど)は、一部のユーザーが2回カウントされ100%を超えることもあるとのこと。
ディメンションに直帰率などがないけど
縦軸をパーセントで表示するということは、いっぽうで直帰率などそもそもパーセントで処理されるものについては、除外しているとのことです。
だいたいの傾向を知ることは役立つの?
Usage Trends の公式ページにこう書いてあります。
生の数字を見ることは面白いですが、傾向を見ることは実践的です。トレンドは将来の計画を立て、準備が整ったことを確認する方法を教えてくれます。
「海外からのアクセスは増えていますか?もし増えているならどれくらい早いですか?」などといったクライアントからの傾向に関する質問に答えることに役立つだろう、としています。
たしかに、トレンドを知り未来を考えることは、より実践的ともいえますよね。
Google Analytics Demos &Tools 全般に関するヒント
公式ページにいくつかヒントが英語で書かれています。
>>使用状況の傾向 – Googleアナリティクスのデモ&ツール
また、GitHubにソースコードも公開されています。※Usage Trends だけではありません。
>>googleanalytics/ga-dev-tools: A showcase of demos and tools built with the various Google Analytics APIs and Libraries.
GitHubのイシューにさまざまなリクエストをすることも出来ます。
>>Issues · googleanalytics/ga-dev-tools
開発に興味があるかたは、こちらの情報源も見られると良いかと思います。
いやはやGoogleアナリティクス、凄いですね。
Webマーケターのためのテクノロジー入門: Webマーケターにとって必要十分なプログラミング・テクノロジーの基礎を解説 | 山田良太 |電子書籍

関連情報リンク
Googleアナリティクスのヘルプもつねに進化して詳しくなっています。図解多めになっています。
>>アナリティクスの使い方 – アナリティクス ヘルプ
デベロッパーツールも進化していますね。
>>What’s New In DevTools (Chrome 61) | Web | Google Developers
Google検索のキーワードトレンドはこちらでチェック。
>>Google トレンド
Googleアナリティクスの詳細な計測仕様やテクニックについての解説。
>>衣袋教授の新・Googleアナリティクス入門講座 コーナーの記事一覧 | Web担当者Forum
Googleアナリティクスの困ったことがあれば、こちらの公式掲示板で相談。
>>すべてのトピック – Google 広告主コミュニティ
まとめ
最近のGoogleアナリティクスは、360のニュースやハイエンドなトピックが多いように感じていた人には、今回のツール提供は朗報なのではないでしょうか。
さくっと、各ディメンションのトレンドがわかる明快さは特筆モノです。また、AIではなく人間に直感的にわかる、という点も嬉しいですね。
これからもGoogleアナリティクス!
・ ・ ・ ・ ・
>>安っ!アマゾンで半額以下になっている食品タイムセール
セール特設ページを見る
↓↓↓無料のニュースレターを配信中です